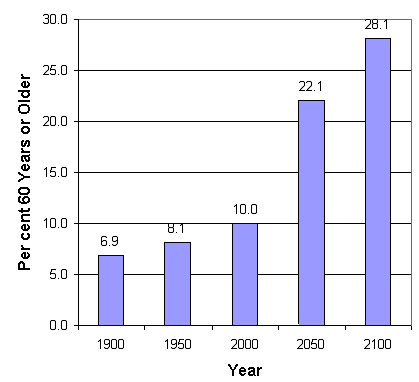
Figure 2: Three Centuries of World Population Aging
Source: Long-Range World Population Projections: Based on the 1998 Revision.
The Population Division, Department of Economic and Social Affairs, United Nations Secretariat
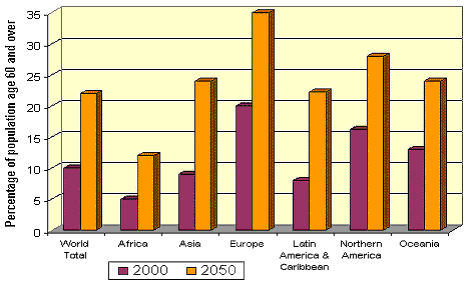
Figure 3: Percentage Increase in Age 60 and Over by Region, 2000-2050
Source: World Population Prospects, The 1998 Revision, Volume II: Sex and Age. The Population Division, Department of Economic and Social Affairs, United Nations Secretariat
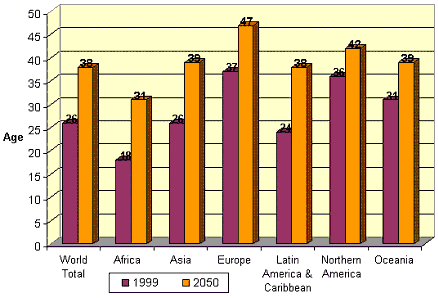
Figure 4: Median Age by Region, 1999-2050
Source: World Population Prospects, The 1998 Revision, Volume II: Sex and Age.
The Population Division, Department of Economic and Social Affairs, United Nations Secretariat
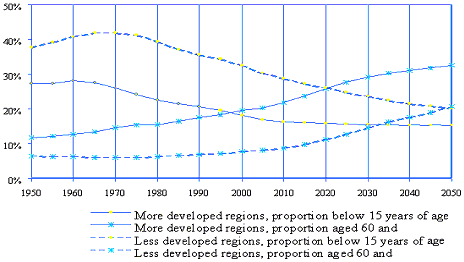
Figure 5: Proportion of Total Population Aged 0-14 and 60 and Over. More and Less Developed Regions, 1950-2050. (Medium Variant Projections) Source: World Population Prospects, The 1998 Revision, Volume II: Sex and Age.
The Population Division, Department of Economic and Social Affairs, United Nations Secretariat
References:
Commission for Social Development acting as the preparatory committee for the Second World Assembly on Ageing; New York, NY; December 10-14, 2001.
Long-Range World Population Projections: Based on the 1998 Revision. The Population Division, Department of Economic and Social Affairs, United Nations Secretariat
The ageing of the world’s population. Population Division, Department of Economic and Social Affairs, United Nations Secretariat.
The Sex and Age Distribution of the World Populations: 1998 Revision, Volume II: Sex and Age (United Nations publication, Sales No. E.99.XIII.8), medium variant projections.
Winker MA. Aging in the 21st Century: A call for papers. JAMA. 2002 Mar 13;287(10):1326.
World Population Prospects, The 1998 Revision, Volume II: Sex and Age. The Population Division, Department of Economic and Social Affairs, United Nations Secretariat
Back to top | Previous Page Page 2 of 2
- Why Healthy Aging Medicine?
- What is Healthy Aging Medicine?*
- Beating Heart Disease – Public Enemy Number One
- HGH, the Master Hormone of Youth*
- The Pacemakers of Youth*
- My Best Friend, My Worst Enemy
- Joining a Longevity Program: What to look for
- Fighting the Aging Process: Quick Fixes and Misconceptions
- Cell First® Theory of Aging
- Other Theories of Aging
- Signs and Symptoms of Aging
- Life Expectancy
